DreamFactory ELK Stack & Grafana Integration Guide
This guide provides step-by-step instructions for installing and configuring Elasticsearch, Logstash, and Grafana to work with DreamFactory's Logstash connector for API activity monitoring and analytics.
Table of Contents
- Prerequisites
- Installation
- Configuration
- DreamFactory Integration
- Dashboard Setup
- Monitoring Data Consumption by App and API Key
- Troubleshooting
Prerequisites
- Ubuntu Server (20.04 or later recommended)
- Root or sudo access
- Minimum 2GB RAM (4GB+ recommended)
- Java 11 or later
- DreamFactory instance with Logstash connector enabled
Installation
Elasticsearch
Step 1: Install Java
sudo apt update
sudo apt install -y openjdk-11-jdk
Step 2: Add Elasticsearch Repository
wget -qO - https://artifacts.elastic.co/GPG-KEY-elasticsearch | sudo apt-key add -
echo "deb https://artifacts.elastic.co/packages/8.x/apt stable main" | sudo tee /etc/apt/sources.list.d/elastic-8.x.list
sudo apt update
Step 3: Install Elasticsearch
sudo apt install -y elasticsearch
Step 4: Configure Elasticsearch Memory
For systems with limited RAM, reduce heap size:
sudo mkdir -p /etc/elasticsearch/jvm.options.d
sudo tee /etc/elasticsearch/jvm.options.d/heap.options << EOF
-Xms256m
-Xmx256m
EOF
Step 5: Start and Enable Elasticsearch
sudo systemctl daemon-reload
sudo systemctl enable elasticsearch
sudo systemctl start elasticsearch
Step 6: Verify Installation
Wait 30 seconds, then check status:
sudo systemctl status elasticsearch
Get the default password:
sudo /usr/share/elasticsearch/bin/elasticsearch-reset-password -u elastic
Test connection:
curl -k -u elastic:YOUR_PASSWORD https://localhost:9200
Logstash
Step 1: Install Logstash
sudo apt install -y logstash
Step 2: Configure Logstash Memory
sudo tee /etc/logstash/jvm.options << EOF
-Xms256m
-Xmx256m
EOF
Step 3: Create Logstash Configuration
Create the DreamFactory configuration file:
sudo tee /etc/logstash/conf.d/dreamfactory.conf << 'EOF'
input {
  gelf {
    port => 12201
    type => "dreamfactory"
  }
}

filter {
  if [type] == "dreamfactory" {
    # Rename host field to avoid conflict with ECS (Elastic Common Schema) host object
    # Note: ECS is a vendor-neutral standard that works across all cloud providers and on-premise
    if [host] {
      mutate {
        rename => { "host" => "source_hostname" }
      }
    }

    # Add host information as object for ECS compatibility
    # This follows the ECS standard and works on AWS, Azure, GCP, on-premise, etc.
    mutate {
      add_field => {
        "log_source" => "dreamfactory"
        "[host][name]" => "%{source_hostname}"
      }
    }

    # Parse log level if present
    if [level] {
      mutate {
        uppercase => [ "level" ]
      }
    }

    # Extract user_id from JWT session token
    ruby {
      code => '
        begin
          # Access nested field directly
          event_data = event.get("event")
          if event_data && event_data.is_a?(Hash)
            request_data = event_data["request"]
            if request_data && request_data.is_a?(Hash)
              headers = request_data["headers"]
              if headers && headers.is_a?(Hash)
                token = headers["x-dreamfactory-session-token"]
                if token && token.is_a?(String) && token.include?(".")
                  parts = token.split(".")
                  if parts.length >= 2
                    payload_b64 = parts[1]
                    # Add padding for base64 URL-safe decoding
                    padding = (4 - payload_b64.length % 4) % 4
                    payload_b64 += "=" * padding
                    # Decode and parse
                    require "base64"
                    require "json"
                    payload_json = Base64.urlsafe_decode64(payload_b64)
                    payload = JSON.parse(payload_json)
                    if payload["user_id"]
                      event.set("[user][id]", payload["user_id"])
                    end
                  end
                end
              end
            end
          end
        rescue => e
          # Silently fail
        end
      '
    }
  }
}

output {
  elasticsearch {
    hosts => ["https://localhost:9200"]
    user => "elastic"
    password => "YOUR_ELASTICSEARCH_PASSWORD"
    ssl_enabled => true
    ssl_verification_mode => "none"
    index => "logstash-dreamfactory-%{+YYYY.MM.dd}"
  }
}
EOF
Important: Replace YOUR_ELASTICSEARCH_PASSWORD with the password you obtained in Step 6 of Elasticsearch installation.
Step 4: Set File Permissions
sudo chown logstash:logstash /etc/logstash/conf.d/dreamfactory.conf
sudo chmod 644 /etc/logstash/conf.d/dreamfactory.conf
Step 5: Test Configuration
sudo /usr/share/logstash/bin/logstash --path.settings=/etc/logstash --config.test_and_exit
Step 6: Start and Enable Logstash
sudo systemctl daemon-reload
sudo systemctl enable logstash
sudo systemctl start logstash
Step 7: Verify Installation
sudo systemctl status logstash
sudo tail -f /var/log/logstash/logstash-plain.log
Grafana
Step 1: Install Dependencies
sudo apt install -y software-properties-common
sudo add-apt-repository "deb https://packages.grafana.com/oss/deb stable main"
Step 2: Add Grafana GPG Key
wget -q -O - https://packages.grafana.com/gpg.key | sudo apt-key add -
sudo apt update
Step 3: Install Grafana
sudo apt install -y grafana
Step 4: Start and Enable Grafana
sudo systemctl daemon-reload
sudo systemctl enable grafana-server
sudo systemctl start grafana-server
Step 5: Access Grafana Web UI
Open your browser and navigate to:
http://YOUR_SERVER_IP:3000
Default credentials:
- Username:
admin - Password:
admin(you'll be prompted to change it)
Configuration
Elasticsearch Configuration
Basic Security Settings
Elasticsearch 8.x has security enabled by default. The default user is elastic with a randomly generated password.
Index Management
Logs are automatically indexed with the pattern: logstash-dreamfactory-YYYY.MM.dd
View indices:
curl -k -u elastic:YOUR_PASSWORD https://localhost:9200/_cat/indices?v
Elasticsearch 8 Compatibility: Security Enabled by Default
Elasticsearch 8.x introduces a significant breaking change from ES7: TLS encryption and authentication are enabled by default. If you are migrating from Elasticsearch 7 or configuring a fresh ES8 installation, connections that worked without credentials in ES7 will fail with connection refused or SSL handshake failed errors in ES8.
When you install Elasticsearch 8 for the first time, the installer outputs a randomly generated password for the elastic superuser and enrolls Kibana automatically with a token. You must save these credentials — the password is shown only once. To reset it:
sudo /usr/share/elasticsearch/bin/elasticsearch-reset-password -u elastic
You have two options for configuring your Logstash-to-Elasticsearch connection with ES8:
Option A: Configure Logstash to Use HTTPS with ES8 Credentials (Recommended for Production)
Update the output block in your /etc/logstash/conf.d/dreamfactory.conf to include TLS settings and credentials. The CA certificate for self-signed ES8 installs is located at /etc/elasticsearch/certs/http_ca.crt:
output {
  elasticsearch {
    hosts => ["https://localhost:9200"]
    user => "elastic"
    password => "YOUR_ELASTICSEARCH_PASSWORD"
    ssl_enabled => true
    # Option 1: Provide the CA cert for full certificate verification (most secure)
    ssl_certificate_authorities => ["/etc/elasticsearch/certs/http_ca.crt"]
    # Option 2: Skip verification (acceptable for same-host setups, not for remote ES)
    # ssl_verification_mode => "none"
    index => "dreamfactory-logs-%{+YYYY.MM.dd}"
  }
}
Copy the CA certificate so Logstash can read it:
sudo cp /etc/elasticsearch/certs/http_ca.crt /etc/logstash/
sudo chown logstash:logstash /etc/logstash/http_ca.crt
sudo chmod 640 /etc/logstash/http_ca.crt
Then update the ssl_certificate_authorities path in your Logstash config to /etc/logstash/http_ca.crt.
Verify the connection works from Logstash's perspective:
curl --cacert /etc/elasticsearch/certs/http_ca.crt \
     -u elastic:YOUR_PASSWORD \
     https://localhost:9200
You should see the ES cluster info JSON — if you do, the certificate and credentials are correct.
Option B: Disable ES8 Security (Non-Production Only)
Disabling Elasticsearch security removes authentication and TLS protection. Do not use this in production or on any network-accessible host. This is only appropriate for local development or isolated test environments.
To disable ES8 security, edit /etc/elasticsearch/elasticsearch.yml and add:
xpack.security.enabled: false
xpack.security.http.ssl.enabled: false
xpack.security.transport.ssl.enabled: false
Then restart Elasticsearch:
sudo systemctl restart elasticsearch
With security disabled, your Logstash output block reverts to the simpler ES7-style config:
output {
  elasticsearch {
    hosts => ["http://localhost:9200"]
    index => "dreamfactory-logs-%{+YYYY.MM.dd}"
  }
}
Logstash Configuration Reference
The following is a complete, annotated logstash.conf for DreamFactory's GELF log output. Save this as /etc/logstash/conf.d/dreamfactory.conf:
# =============================================================
# DreamFactory → Logstash → Elasticsearch Pipeline
# =============================================================

input {
  # DreamFactory sends logs via GELF (Graylog Extended Log Format) over UDP.
  # Default port is 12201. Configure the same port in DreamFactory Admin >
  # Services > Logstash connector settings.
  gelf {
    port => 12201
    type => "dreamfactory"
  }
}

filter {
  if [type] == "dreamfactory" {

    # DreamFactory log fields (top-level):
    #   host        - hostname of the DreamFactory server
    #   level       - log severity: DEBUG, INFO, WARNING, ERROR
    #   short_message - brief description of the event
    #   full_message  - full event payload (may include request/response)
    #   timestamp   - event time (Unix epoch)
    #
    # DreamFactory event fields (nested under [event]):
    #   [event][request][method]   - HTTP method: GET, POST, PUT, DELETE, PATCH
    #   [event][request][uri]      - full request URI, e.g. /api/v2/mydb/_table/orders
    #   [event][request][service]  - service name, e.g. "mydb", "system", "files"
    #   [event][request][resource] - resource path within the service
    #   [event][request][headers]  - request headers map (includes API key and session token)
    #   [event][response][status]  - HTTP response status code
    #   [event][response][content] - response body (if log level includes response)

    # Rename [host] string to avoid conflict with ECS [host] object
    if [host] {
      mutate {
        rename => { "host" => "source_hostname" }
        add_field => { "[host][name]" => "%{source_hostname}" }
      }
    }

    mutate {
      add_field => { "log_source" => "dreamfactory" }
      uppercase => [ "level" ]
    }

    # Extract user_id from the DreamFactory JWT session token so dashboards
    # can show per-user activity without requiring a separate lookup.
    ruby {
      code => '
        begin
          event_data = event.get("event")
          if event_data&.is_a?(Hash)
            token = event_data.dig("request", "headers", "x-dreamfactory-session-token")
            if token.is_a?(String) && token.include?(".")
              parts = token.split(".")
              if parts.length >= 2
                require "base64"
                require "json"
                padding = (4 - parts[1].length % 4) % 4
                payload = JSON.parse(Base64.urlsafe_decode64(parts[1] + "=" * padding))
                event.set("[user][id]", payload["user_id"]) if payload["user_id"]
              end
            end
          end
        rescue => e
          # silently skip malformed tokens
        end
      '
    }
  }
}

output {
  elasticsearch {
    # Use https:// for Elasticsearch 8.x (security enabled by default).
    # Switch to http:// only if you have explicitly disabled xpack.security.
    hosts => ["https://localhost:9200"]
    user => "elastic"
    password => "YOUR_ELASTICSEARCH_PASSWORD"
    ssl_enabled => true
    ssl_certificate_authorities => ["/etc/logstash/http_ca.crt"]
    # Index pattern: creates one index per day for easier lifecycle management.
    # Grafana datasource index pattern should be set to "dreamfactory-logs-*"
    index => "dreamfactory-logs-%{+YYYY.MM.dd}"
  }
}
After saving the file, test the configuration before starting:
sudo /usr/share/logstash/bin/logstash \
  --path.settings=/etc/logstash \
  --config.test_and_exit
A successful test outputs Configuration OK. Then restart Logstash:
sudo systemctl restart logstash
sudo journalctl -u logstash -f
Grafana Dashboard Setup
Once Logstash is indexing DreamFactory events into Elasticsearch, connect Grafana to visualize the data.
Connecting Grafana to the dreamfactory-logs-* Index
In Grafana, navigate to Connections → Data Sources → Add data source → Elasticsearch. Use these settings:
| Field | Value |
|---|---|
| URL | https://localhost:9200 |
| Access | Server (default) |
| Basic Auth | Enabled |
| User | elastic |
| Password | Your Elasticsearch password |
| TLS/SSL mode | Skip TLS verification (or provide CA cert) |
| Index name | dreamfactory-logs-* |
| Time field | @timestamp |
| Version | 8.0+ |
Click Save & Test — you should see "Data source connected and index found."
Dashboard Panels to Create
Build panels that answer the operational questions your team cares about most:
1. Requests per Minute
- Visualization: Time series
- Query: Count all documents with
type:dreamfactory - Bucket aggregation: Date histogram on
@timestamp, interval1m - This shows throughput trends and helps identify traffic spikes.
2. Error Rate by HTTP Status Code
- Visualization: Bar chart or time series
- Query:
event.response.status:>=400 - Bucket aggregations: Date histogram → Terms on
event.response.status - Use a threshold alert at >5% error rate to catch service degradation early.
3. Top API Consumers by API Key / User
- Visualization: Table
- Query:
event.request.method:* - Bucket aggregation: Terms on
user.id(size 20, order by count desc) - Join with DreamFactory's
/api/v2/system/userendpoint (via Grafana Infinity datasource) to resolve user IDs to email addresses.
4. Slowest Endpoints
- Visualization: Table sorted by average response time
- Requires DreamFactory to log response duration. If the
full_messagefield includes timing data, parse it with a Logstashgrokfilter and store it asresponse_ms. - Query:
event.request.uri:* - Aggregation: Terms on
event.request.uri.keyword→ Avg onresponse_ms
Importing a Pre-Built Dashboard
If DreamFactory provides a dashboard JSON export:
- In Grafana, click Dashboards → Import
- Upload the JSON file or paste its contents
- Select your
DreamFactory LogsElasticsearch datasource when prompted - Click Import
The dashboard will appear under your configured folder. Set the default time range to Last 24 hours and auto-refresh to 1 minute.
Monitoring Data Consumption by App and API Key
Beyond operational health, the Logstash connector is DreamFactory's data-consumption feed: every API event it ships answers "which identity called which service and endpoint, when, and with what response." This makes the ELK stack a consumption-metering layer for all DreamFactory-governed APIs, not just an error log.
What Each Event Contains
For each event key you enable on the Logstash service, you choose which context to ship:
_event— the serialized API request and response: method, URI, service name, resource path, headers, and response status/content (depending on log context). Credentials, session tokens, and API keys are redacted by DreamFactory before the event leaves the platform._platform— the session and user context for the call: which user and session were active when the request ran.
Because DreamFactory requires every request to present an API key bound to an application and role, the shipped events carry the identity attribution needed for per-consumer reporting — the same identity fabric described in API Keys and Role-Based Access Control.
Consumption Panels for Grafana
Extending the four dashboard panels above, two more answer the consumption question directly:
5. Top Consumers by App / API Key
- Visualization: Table or bar chart
- Query:
event.request.method:* - Bucket aggregation: Terms on the app/API-key field available in your shipped event context (order by count desc)
- This is the per-application counterpart to the per-user panel: one row per consuming application, ranked by request volume.
6. Request Volume per Service
- Visualization: Time series (stacked)
- Query:
event.request.service:* - Bucket aggregations: Date histogram on
@timestamp→ Terms onevent.request.service.keyword - Shows which backend APIs (databases, files, custom services) each slice of traffic is consuming over time.
Together with the existing user.id panels, these give you consumption broken down by user, application, service, and endpoint — the raw material for showback reports on data access.
Correlating with AI Usage and Cost
GELF events tell you who called what; token counts and estimated AI cost live in DreamFactory's ai_usage_log, not in the GELF stream. To bring AI spend into the same ELK stack, pull the AI audit stream — GET /_internal/ai/audit-stream returns NDJSON events designed for Logstash's http_poller input (the example configuration lives in AI Gateway Analytics).
For per-app, per-user, per-role, and per-model token and cost attribution — and for chargeback reporting built on it — see AI Usage Monitoring & Cost Allocation.
Troubleshooting
Connection refused from DreamFactory to Logstash
If DreamFactory cannot reach Logstash, confirm the Logstash service is running and listening on UDP port 12201:
sudo systemctl status logstash
sudo tail -f /var/log/logstash/logstash-plain.log
Check firewall rules allow inbound UDP traffic on port 12201. The DreamFactory log connector must use the same host and port as the GELF input plugin.
GELF port or protocol mismatch
The GELF input in this guide listens on UDP port 12201. The connector settings must match:
- Host: The IP or hostname where Logstash is running
- Port:
12201 - Protocol: GELF over UDP
A mismatch between the connector's port/protocol and the GELF input drops logs silently.
Elasticsearch 8 TLS rejection
Elasticsearch 8.x enables security by default and expects HTTPS. The Logstash output in this guide uses:
https://localhost:9200as the Elasticsearch URLssl_enabled => true- the CA certificate extracted during installation (
ssl_certificate_authorities)
Without that TLS setup, Logstash fails to push indices to Elasticsearch.
Missing log entries from level filtering
The Logstash filter grok pattern in this guide recognizes DEBUG, INFO, WARNING, and ERROR. If expected entries are missing:
- Confirm the log level is one of those four values
- Check DreamFactory's log context and minimum level in the Admin UI — events below that level are never emitted
- Compare the incoming payload against the complete Logstash configuration reference on this page
Connection Refused to Elasticsearch
Symptom: Logstash logs show Connection refused - connect(2) for "localhost" port 9200 or Grafana shows "No data."
Causes and fixes:
- Elasticsearch is not running:
sudo systemctl status elasticsearch. Start it if stopped. - Firewall is blocking port 9200:
sudo ufw allow 9200/tcp(or adjust your iptables rules). - ES8 is running on HTTPS but Logstash is configured with
http://: changehoststo["https://localhost:9200"].
Index Not Created in Elasticsearch
Symptom: Logstash starts without errors but no dreamfactory-logs-* index appears.
Causes and fixes:
- Logstash is not receiving GELF events from DreamFactory yet — generate some API calls and check:
sudo tcpdump -i lo -n udp port 12201 - Logstash output is failing silently — check the Logstash log for ES errors:
sudo tail -100 /var/log/logstash/logstash-plain.log | grep -i error - Authentication failure: verify your ES password is correct with a direct curl:
curl -k -u elastic:YOUR_PASSWORD https://localhost:9200 - SSL certificate error: ensure
ssl_certificate_authoritiespoints to the correct CA cert file and that thelogstashuser can read it.
Grafana "No Data" on Panels
Symptom: Grafana datasource test passes, but panels show "No data."
Causes and fixes:
- Index pattern mismatch: the Grafana datasource index name must be
dreamfactory-logs-*(with the wildcard), matching the Logstash outputindexvalue. - Time range issue: Grafana's default time range may not overlap with when logs were indexed — try setting the time picker to "Last 7 days."
@timestampfield not mapped: Elasticsearch needs@timestampas a date field. Verify:curl -k -u elastic:YOUR_PASSWORD "https://localhost:9200/dreamfactory-logs-*/_mapping/field/@timestamp"- If the mapping is missing, delete the index and let Logstash recreate it with proper field mappings.
Logstash Configuration
Key Configuration Points
- GELF Input: Listens on UDP port 12201 for Graylog Extended Log Format (GELF) messages from DreamFactory
- JWT Extraction: Extracts
user_idfrom DreamFactory session tokens and adds it asuser.idfield - Field Mapping: Renames
hosttosource_hostnameto avoid Elasticsearch mapping conflicts - ECS Compatibility: Uses Elastic Common Schema (ECS) standard for
host.namefield - this is vendor-neutral and works across all cloud providers (AWS, Azure, GCP, etc.) and on-premise installations - Index Pattern: Creates daily indices for better performance and management
Verify Logstash is Receiving Logs
sudo netstat -tlnp | grep 12201
Check Logstash Logs
sudo tail -f /var/log/logstash/logstash-plain.log
Grafana Configuration
Step 1: Add Elasticsearch Data Source
- Go to Configuration → Data Sources
- Click Add data source
- Select Elasticsearch
- Configure:
- Name:
DreamFactory Logs - URL:
https://localhost:9200 - Access: Server (default)
- Basic Auth: Enabled
- User:
elastic - Password: Your Elasticsearch password
- User:
- TLS/SSL Mode: Skip TLS Verification
- Index name:
logstash-dreamfactory-* - Time field:
@timestamp - Version:
8.0+
- Name:
- Click Save & Test
Step 2: Add Infinity Data Source (for User Enrichment)
Prerequisites: Create a Least-Privilege API Key
Before configuring the Infinity data source, create a DreamFactory API key with minimal permissions:
- Log into DreamFactory Admin Console
- Navigate to Roles → Create a new role (e.g., "Grafana Read-Only")
- Set Role Permissions (see Role-Based Access Control for detailed information):
- Service:
system - Component:
user - Access:
GETonly (read-only) - Fields: Allow access to:
id,first_name,last_name,email(user/* in the Component section will give permission to view all user fields if needed)
- Service:
- Create API Key:
- Go to Users → Select or create a user
- Assign the "Grafana Read-Only" role to the user
- Generate an API key for this user
- Note: This API key will only have read access to user data, not full admin access
Alternative: Use Existing Role with Limited Permissions
- If you have a read-only role, you can use an existing API key with that role
- Ensure the role has GET access to
system/userendpoint
Configure Infinity Data Source:
-
Install Infinity plugin (if not already installed):
sudo grafana-cli plugins install yesoreyeram-infinity-datasource
sudo systemctl restart grafana-server -
Go to Configuration → Data Sources
-
Click Add data source
-
Select Infinity
-
Configure:
- Name:
DreamFactory API - URL:
http://localhost(or your DreamFactory URL) - Authentication: API Key
- Add header:
X-DreamFactory-API-Keywith your least-privilege API key (created in the Prerequisites section above) - Security Note: Use the read-only API key, not an admin key
- Add header:
- Name:
-
Click Save & Test
DreamFactory Integration
Step 0: Create Least-Privilege API Key for Grafana
The Infinity data source only needs read access to user data. Create a minimal-permission API key:
Option 1: Create a Custom Read-Only Role (Recommended)
- Log into DreamFactory Admin Console
- Navigate to: Roles → Create Role
- Role Configuration:
- Name:
grafana-readonly(or similar) - Description:
Read-only access for Grafana user enrichment
- Name:
- Set Service Access:
- Service:
system - Component:
user - Access:
GETonly - Fields:
id,first_name,last_name,email(or leave blank for all fields)
- Service:
- Save the role
Option 2: Use Existing Read-Only Role
If you already have a read-only role with system/user GET access, you can use that.
Create API Key with the Role
- Navigate to: Users → Select a user (or create a dedicated user like
grafana-service) - Assign Role: Add the
grafana-readonlyrole to the user - Generate API Key:
- Go to the user's profile
- Generate or copy the API key
- Store securely - this key will be used in Grafana configuration
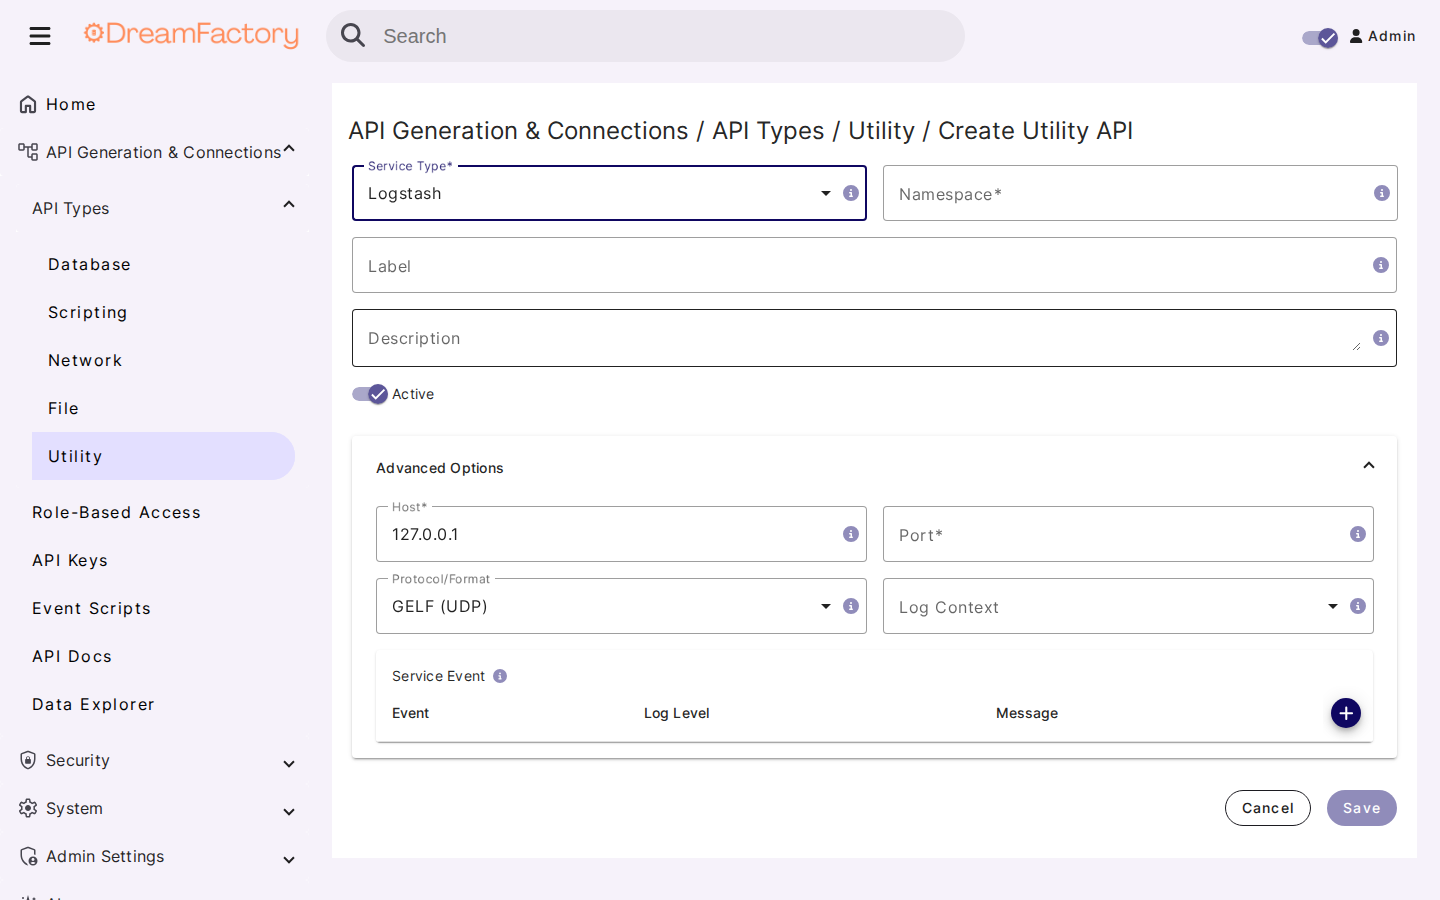
Step 1: Enable Logstash Connector in DreamFactory
- Log into DreamFactory Admin Console
- Navigate to Services → System → Logstash
- Enable the Logstash connector
- Configure:
- Host:
localhost(or your Logstash server IP) - Port:
12201 - Protocol:
GELF (UDP) - Log Context:
Request AllService Event: (These are the Events necessary to integrate Logstash with our template Grafana Dashboard) - Event: user.* | Log level: INFO | Message: System Activity
- Event: db.* | Log Level: INFO | Default Database Activity (db is a local SQLite database typically included with all DreamFactory installations)
- Event: files.* | Log Level: INFO| File Activity
- To add your own Database or other service connection start typing the name of your service and select the service followed by * or your specfic criteria
- Host:
- Save configuration
Step 2: Verify Logs are Being Sent
Check if DreamFactory is sending logs: (Generate some API requests or logins to see them appear in the logs)
sudo tcpdump -i any -n udp port 12201
Or check Logstash logs:
sudo tail -f /var/log/logstash/logstash-plain.log | grep dreamfactory
Step 3: Verify Logs in Elasticsearch
curl -k -u elastic:YOUR_PASSWORD "https://localhost:9200/logstash-dreamfactory-*/_search?size=1&pretty"
Dashboard Setup
Creating the User Activity Dashboard
Panel 1: Total API Calls by User
Purpose: Shows the total number of API calls made by each user with email enrichment.
Query Configuration:
- Data Source: DreamFactory Logs (Elasticsearch)
- Query Type: Count
- Query:
user.id:* event.request.method:* - Bucket Aggregations:
- Terms:
user.id(Size: 50, Order: Desc by _count)
- Terms:
- Time Field:
@timestamp
Second Query (for email enrichment):
- Data Source: DreamFactory API (Infinity)
- Type: JSON
- URL:
/api/v2/system/user?fields=id,first_name,last_name,email&limit=100 - Parser: Backend
- Root Selector:
resource
Transformations:
- Join by field: Join query A and B on
user.id(Mode: Outer) - Organize fields:
- Exclude:
first_name B,last_name B,user.id,user.id 1,user.id 2 - Rename:
Count→Total API Calls,email B→User Email
- Exclude:
- Filter data by values:
- Field:
Total API Calls - Condition:
IS NOT NULL
- Field:
Field Mappings:
- Map empty/null email values to "Admin User"
The Dashboard should end up looking similar to this:
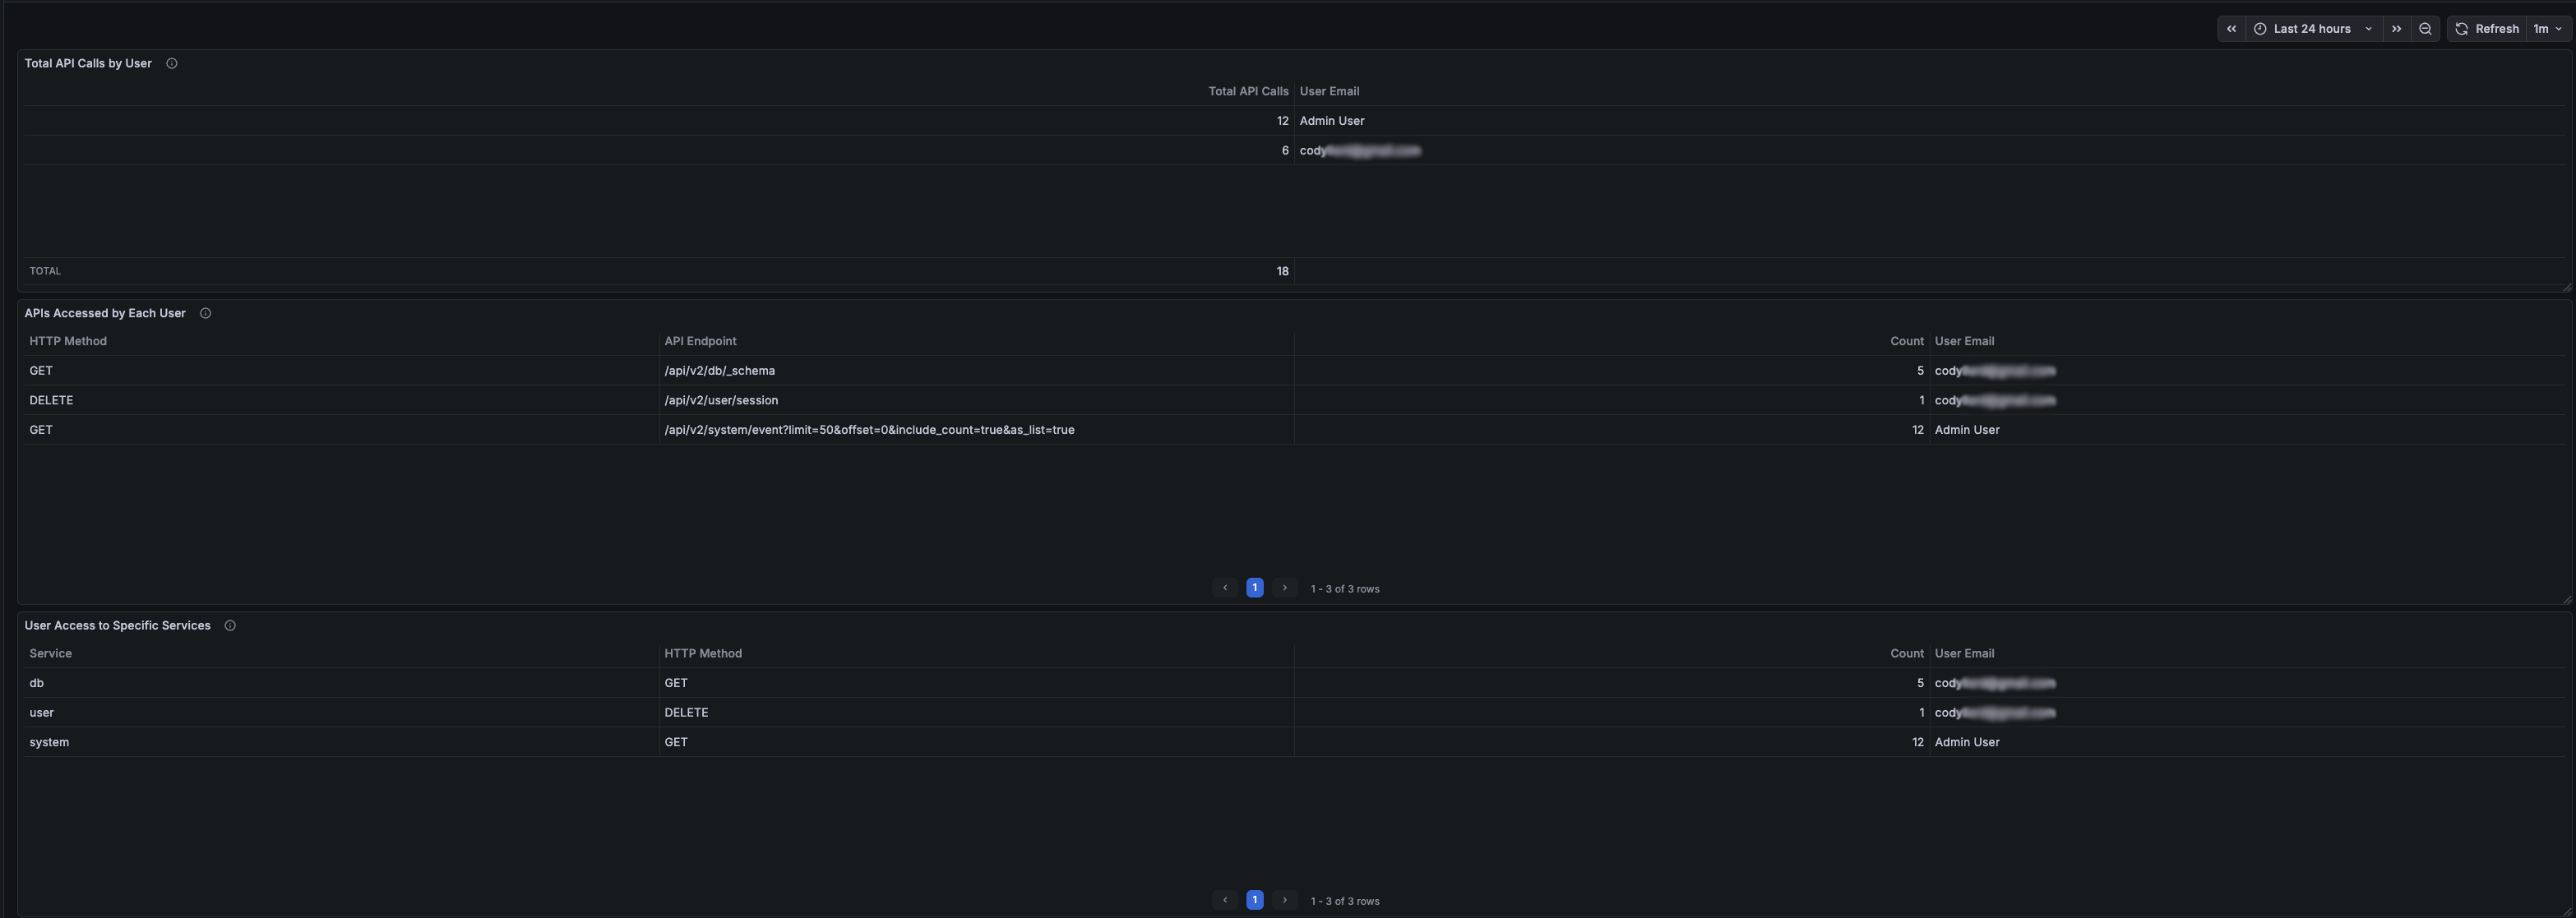
When there are no calls in the selected time frame for a user the panels should all be empty as the filters we applied should remove any row with no calls.
Panel 2: APIs Accessed by Each User
Purpose: Shows which specific API endpoints each user accessed with HTTP method details.
Query Configuration:
- Data Source: DreamFactory Logs (Elasticsearch)
- Query Type: Count
- Query:
user.id:* event.request.method:* event.request.uri:* - Bucket Aggregations:
- Terms:
user.id(Size: 20, Order: Desc by _count) - Terms:
event.request.method.keyword(Size: 10, Order: Desc by _count) - Terms:
event.request.uri.keyword(Size: 25, Order: Desc by _count)
- Terms:
- Time Field:
@timestamp
Second Query (for email enrichment):
- Same as Panel 1
Transformations:
- Join by field: Join on
user.id(Mode: Outer Tabular) - Organize fields:
- Exclude:
first_name B,last_name B,user.id,user.id 1,user.id 2 - Rename:
email B→User Emailevent.request.method.keyword→HTTP Methodevent.request.uri.keyword→API Endpoint
- Exclude:
- Filter data by values:
- Field:
Count(or your count column) - Condition:
IS NOT NULL
- Field:
Panel 3: User Access to Specific Services
Purpose: Shows which DreamFactory services each user accessed.
Query Configuration:
- Data Source: DreamFactory Logs (Elasticsearch)
- Query Type: Count
- Query:
user.id:* event.request.method:* event.request.service:* - Bucket Aggregations:
- Terms:
user.id(Size: 20, Order: Desc by _count) - Terms:
event.request.service.keyword(Size: 15, Order: Desc by _count) - Terms:
event.request.method.keyword(Size: 10, Order: Desc by _count)
- Terms:
- Time Field:
@timestamp
Second Query (for email enrichment):
- Same as Panel 1
Transformations:
- Join by field: Join on
user.id(Mode: Outer Tabular) - Organize fields:
- Exclude:
first_name B,last_name B,user.id,user.id 1,user.id 2 - Rename:
email B→User Emailevent.request.method.keyword→HTTP Methodevent.request.service.keyword→Service
- Exclude:
- Filter data by values:
- Field:
Count - Condition:
IS NOT NULL
- Field:
Dashboard Settings
Time Range: Set to "Last 24 hours" (adjustable)
Refresh Interval: 1 minute (recommended)
Tags: dreamfactory, users, api, activity
Dashboard Function and Use
Overview
The dashboard provides comprehensive visibility into DreamFactory API usage by individual users, helping administrators:
- Monitor User Activity: See which users are actively using the API
- Identify API Usage Patterns: Understand which endpoints and services are most accessed
- Troubleshoot Issues: Track user-specific API calls for debugging
- Security Auditing: Monitor API access patterns for security analysis
Key Features
User Identification
- User ID Extraction: Automatically extracts user IDs from JWT session tokens
- Email Enrichment: Joins with DreamFactory user database to show email addresses
- Admin User Handling: Maps null/empty emails to "Admin User" for system-level operations
Data Filtering
- Method-Based Filtering: Only shows users with actual HTTP method calls (GET, POST, etc.)
- Complete Data Only: Filters out rows with missing data using transformation filters
- Real-Time Updates: Refreshes every minute to show current activity
Aggregation Levels
- User-Level: Total calls per user
- Endpoint-Level: Specific API endpoints accessed
- Service-Level: DreamFactory services accessed (db, system, files, etc.)
Use Cases
-
Activity Monitoring
- Identify most active users
- Track API usage trends
- Monitor system load by user
-
Troubleshooting
- Find which user made a specific API call
- Track user-specific errors
- Debug authentication issues
-
Security Auditing
- Monitor unusual access patterns
- Track service access by user
- Identify potential security issues
-
Capacity Planning
- Understand API usage patterns
- Plan for user growth
- Optimize service performance
Interpreting the Data
- Total API Calls: Sum of all HTTP requests made by a user
- HTTP Method: Type of request (GET, POST, PUT, DELETE, etc.)
- API Endpoint: Specific DreamFactory API path accessed
- Service: DreamFactory service category (db, system, files, etc.)
- User Email: Email address from DreamFactory user database (or "Admin User" for system operations)
Maintenance
Regular Tasks
-
Monitor Disk Space: Elasticsearch indices can grow large
curl -k -u elastic:YOUR_PASSWORD "https://localhost:9200/_cat/indices?v" -
Index Management: Consider setting up index lifecycle management
# Delete old indices (example: older than 30 days)
curl -k -u elastic:YOUR_PASSWORD -X DELETE "https://localhost:9200/logstash-dreamfactory-2024.12.*" -
Log Rotation: Monitor Logstash logs
sudo logrotate -d /etc/logrotate.d/logstash -
Performance Monitoring: Check Elasticsearch cluster health
curl -k -u elastic:YOUR_PASSWORD "https://localhost:9200/_cluster/health?pretty"
If you have any issues or need help with a specifc Grafana dashboard panel please reach out to DreamFactory support!